Water Quality Testing
An ongoing, transparent log of water testing results for Great Hill Pond
Friends of Great Hill Pond will use this page to publish water quality testing results as they become available — including testing conducted by Chatham Health District and by The Pond and Lake Connection's laboratory partner, and eventually results from FoGHP's own testing program once that's underway. New results will be added below as new rounds of testing occur, so this page will keep growing over time.
Testing Log
A Great Hill Pond property owner along Lake Road independently collected three water samples on 8/5/2026 and 8/7/2026 and submitted them to Northeast Laboratories of Rocky Hill, Connecticut, an independent laboratory accredited to the ISO/IEC 17025 standard and certified by the State of Connecticut (CT Cert. #PH-0404, EPA Cert. #CT-024), for E. coli, cyanobacteria identification, and microcystins testing.
E. coli — Private Beach, 60 Lake Rd
240 CFU/100 mLCyanobacteria ID & Microcystins — Private Dock (Active Bloom), 60 Lake Rd
580,000 cyanobacteria cells/mLCyanobacteria ID & Microcystins — End of Right-of-Way, next to 60 Lake Rd
1,700,000 cyanobacteria cells/mLRead these results in context: all three samples were collected directly from the surface of a visible, active cyanobacteria bloom at a private shoreline, not from open water away from the bloom. That is a deliberate choice to characterize the bloom itself, not a random or representative sample of the pond as a whole, and the results above should not be read as describing general pond conditions. Regardless, use caution when entering the water anywhere on the pond, keep pets out, and follow Chatham Health District's guidance to avoid swimming in or near any visible bloom — blooms can move with wind and current.
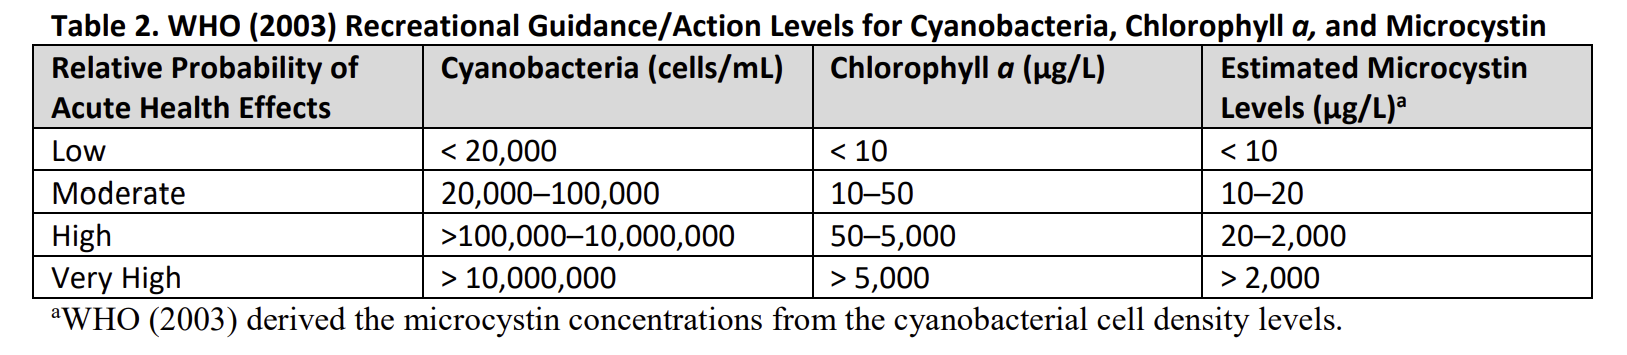
For context: both cyanobacteria cell counts are far into the "high" tier of the WHO 2003 recreational guidance (view guidance table →) already cited elsewhere on this page, which rates high probability of acute health effects above 100,000 cells/mL.
On the microcystin numbers: the EPA's recommended recreational value for microcystins is 8 µg/L (ppb), derived from the higher incidental ingestion of recreating children and intended as a single-day swimming advisory threshold (EPA 822-R-19-001, May 2019). That same EPA document records Connecticut's own suggested threshold, as of its 2019 survey of state guidelines, as 4 µg/L microcystin. Both samples here came back ≥5 ppb, which is the reporting ceiling of the Abraxis screening test used. That tells us the concentration was at least 5 ppb but not what it actually was. Read against the 4 µg/L figure, both samples were above it. Read against the 8 µg/L figure, the test cannot tell us whether they were above or below.
View the CT DPH/DEEP Swimming Water Standard →View the EPA Microcystin Recreational Criteria →
Friends of Great Hill Pond member and citizen scientist Frank Galicia conducted a round of field water quality testing at two locations, Middle Pond and the Dam, using a home water test kit. This is volunteer field-kit testing, not a certified laboratory analysis like the Chatham Health District and SePRO Lab results elsewhere on this page. Think of it as a screening tool the group plans to run several more times a year to help spot trends between professional testing rounds.
| Parameter | Middle Pond | Dam |
|---|---|---|
| Dissolved Oxygen (ppm) | 8Normal | 8Normal |
| pH | 7.5Normal | 8.0Normal |
| Phosphate (ppm) | 1High | 1High |
| Nitrate (ppm) | 5Elevated | 5Elevated |
| Turbidity | Normal | Normal |
| Total Coliform | Positive | Not tested |
This round also included basic nutrient readings, with phosphate reported at 1 ppm at both sites and nitrate at 5 ppm, which the kit's scale places in an "eutrophic-elevated" range. The readings above are reproduced exactly as the field kit reported them.
Update, July 28, 2026: certified laboratory testing of a sample collected on July 9, a week before this round, did not corroborate those two nutrient readings. The state laboratory measured total phosphorus at 0.014 mg/L and found nitrate below its detection limit, both well within the normal range for a healthy lake. Because total phosphorus accounts for every form of phosphorus present, the 1 ppm phosphate reading here is not consistent with it. Color-comparison strips of the kind used in this round are known to lose accuracy at the low nutrient levels found in clean water, and the certified panel agrees with this round on pH and turbidity, so the discrepancy appears specific to the nutrient tests. See the July 9 entry below for the full chemistry results. We are leaving this round's readings published as reported; treat its nutrient figures as a screening prompt rather than as measurements.
Total coliform is a presumptive indicator test: a positive result means bacteria from the broad coliform group were detected, but that group ranges from common, harmless soil and environmental bacteria to species associated with human or animal waste, including E. coli. A positive result doesn't confirm E. coli or another pathogen is present on its own. The report recommends confirmatory coliform testing and, if warranted, dedicated E. coli testing to help identify the source. It's also not directly comparable to Chatham Health District's July 2026 testing below: that was a certified lab test specifically for E. coli, at different shoreline locations, and it came back negative. This round tested for the broader coliform group, not E. coli specifically, at different sites (Middle Pond and the Dam), and coliform wasn't tested at the Dam at all.
View Full Report →Chatham Health District collected two samples from Great Hill Pond: one of surface water from the shore along 54 Lake Rd, approximately 20 feet from a watershed outlet pipe, and one of water from the spring along the pond's shoreline. Neither sample showed any evidence of E. coli, and the spring sample also showed no evidence of total coliform bacteria.
Surface Water
E. coli not detectedSpring Water
E. coli & coliform not detectedFull Water Chemistry (Surface Sample)
The complete chemistry panel for the surface sample came back on July 28, 2026. Chatham Health District collected the sample; the analysis was performed by the Connecticut Department of Public Health's Dr. Katherine A. Kelley State Public Health Laboratory in Rocky Hill. Twenty parameters were measured. Nothing in the panel indicates nutrient enrichment or contamination, and the results are consistent with a healthy, moderately soft Connecticut lake.
| Parameter | Result |
|---|---|
| Nutrients | |
| Phosphorus, Total | 0.014 mg/LLow |
| ortho-Phosphate (as P) | <0.50 mg/L Not detected |
| Nitrate (as N) | <0.20 mg/L Not detected |
| Nitrite (as N) | <0.20 mg/L Not detected |
| Ammonia (as N) | <0.10 mg/L Not detected |
| Total Kjeldahl Nitrogen | <0.60 mg/L Not detected |
| Organic Nitrogen | <0.60 mg/L Not detected |
| Physical & General | |
| pH | 7.4Normal |
| Turbidity | 1.2 NTULow |
| Total Dissolved Solids | 52 mg/LLow |
| Total Suspended Solids | <4 mg/L Not detected |
| Chemical Oxygen Demand | <20 mg/L Not detected |
| Gross Appearance | Fine suspended particlesObservation |
| Color, Descriptive | Light brownObservation |
| Minerals & Hardness | |
| Total Hardness | 18 mg/LSoft water |
| Calcium Hardness | 14 mg/LSoft water |
| Calcium | 5.5 mg/LObservation |
| Magnesium | 1.1 mg/LObservation |
| Alkalinity | 16 mg/LLow buffering |
| Chloride | 21 mg/LLow |
A "less than" value means the parameter was below the level the laboratory's method can reliably measure, not necessarily that it is absent entirely. Every form of nitrogen tested (nitrate, nitrite, ammonia, Kjeldahl and organic) came back below detection.
What stands out: total phosphorus measured 0.014 mg/L (14 parts per billion), which falls within the range typical of a healthy Connecticut lake and agrees with the mesotrophic, or moderate, nutrient classification that SePRO Lab assigned the pond in its August 2024 baseline further down this page. The water is soft and lightly buffered (total hardness 18 mg/L, alkalinity 16 mg/L), which is normal for this part of Connecticut but does mean the pond has limited natural capacity to neutralize acidic input. Chloride at 21 mg/L is modest, well below the 230 mg/L chronic threshold Connecticut uses to protect aquatic life. The light brown color and fine suspended particles the lab noted are a common natural feature of ponds like this one, generally from tannins leaching out of leaf litter, and the low turbidity reading of 1.2 NTU confirms the water was still clear.
How this compares to the July 16 field-kit round above: these certified results do not corroborate the elevated phosphate (1 ppm) and nitrate (5 ppm) readings from the volunteer round conducted a week later. The decisive figure is total phosphorus. Because that measurement captures every form of phosphorus in the sample, no individual form can exceed it, and at 0.014 mg/L it is roughly twenty times lower than the field kit's phosphate reading once the two are converted to the same units. Nitrate is contradicted the same way. Color-comparison test strips are widely known to be unreliable at the low nutrient concentrations found in a clean lake, which is the most likely explanation. The field kit did agree with the laboratory on pH and turbidity, so it remains useful as a between-rounds screening tool. Its nutrient numbers, though, should be read as a prompt to test properly rather than as measurements in their own right.
View Full Chemistry Report →Following the water quality concerns raised after the summer 2024 Fanwort treatment (see the Projects page Treatment Log), The Pond and Lake Connection collected an algae and water sample from Great Hill Pond and submitted it to SePRO Lab, an independent water diagnostics laboratory, for algae identification and a water quality baseline analysis.
Algae ID & Water Quality Baseline
Cyanobacteria present, low health riskFor context: the World Health Organization's 2003 recreational guidance (view guidance table →) rates a "low" probability of acute health effects at cyanobacteria counts under 20,000 cells/mL — the 7,200 cells/mL found here falls well within that range. Chlorophyll a, a broader measure of algal productivity, came back at 12.4 µg/L, which falls at the low end of WHO's "moderate" band (10–50 µg/L) rather than its "low" band (under 10). The lab's own report rated the sample toward the center of its healthy-to-polluted scale, reflecting nutrient and algae levels it considers worth managing over time — a treatment-planning assessment, not a statement of recreational safety.